
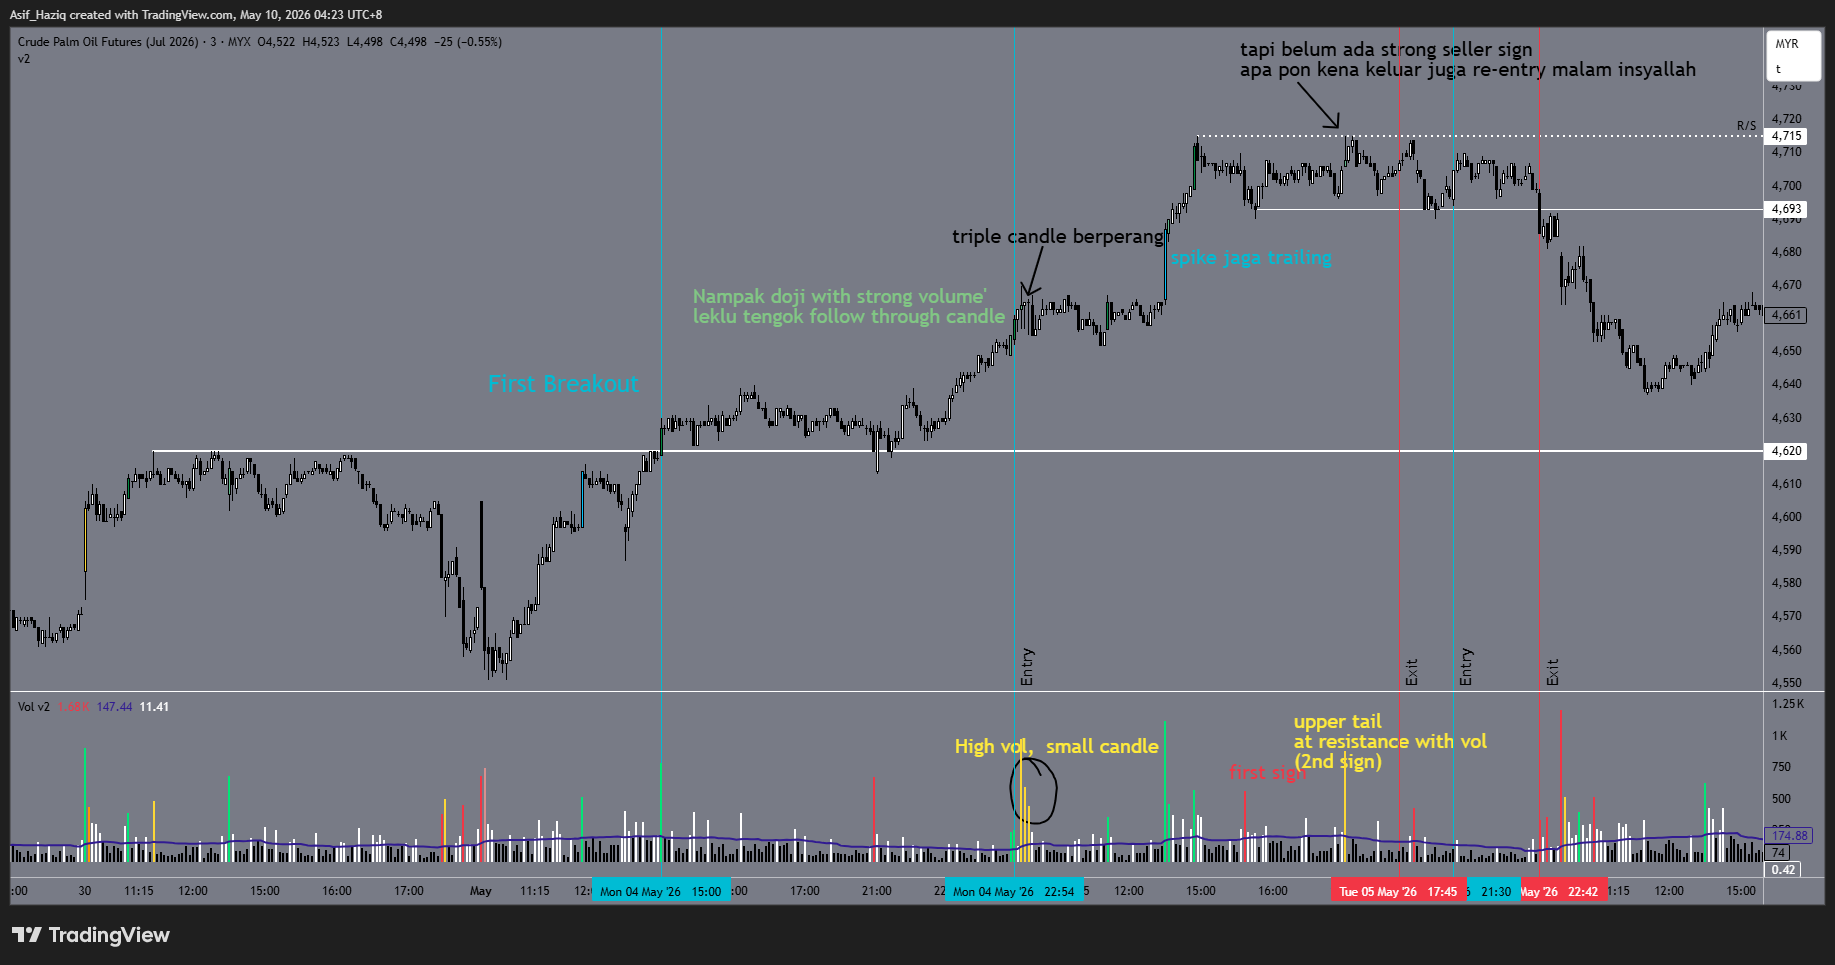
T1 · Long 4660 → 4706 · +46 pts · +MYR 1,150
Win
Entry triggered on breakout of the horizontal base at ~4,620, confirmed by the doji+high volume setup you noted (“nampak doji with strong volume, lelu tengok follow through candle”). Price ran cleanly to the R/S zone at 4,715. Exit at 4,706 — 9 pts below the R/S resistance. Your own annotation acknowledges this: “tapi belum ada strong seller sign, apa pon kena keluar juga.” Correct discipline to take profit near resistance even without a clear reversal signal. However, the triple-candle battle zone and “spike juga trailing” note suggest trailing was spiked too tight near the top — price may have continued further if trailing had more room.
Loss
Re-entry long at 4,699 — only 16 pts below the R/S resistance at 4,715. Your chart already flagged two warning signs before entry: an upper tail candle at resistance with volume (“upper tail at resistance with vol, 2nd sign”) and a “first sign” volume spike. These are reversal signals, not continuation signals. Entering long after seeing upper tail rejection at resistance is counter to the setup. Price then broke structure downward and SL/exit triggered at 4,685.
- Don’t re-enter long near known resistance. T2’s entry at 4,699 with R/S at 4,715 left only 16 pts of upside. For a long re-entry to be valid, you need either a clean pullback to a new base, or a confirmed break and retest of the 4,715 resistance turning support. Neither happened.
- Upper tail + volume at resistance = exit signal, not entry. You correctly identified this as the “1st sign” and “2nd sign” on the chart. Trust those labels — if you’re writing “upper tail at resistance with vol” on the chart, that’s a reason to stay out or look short, not go long.
- Trailing SL near resistance: give it structural room. On T1, “spike juga trailing” suggests the trailing was tightened near the top. Near R/S zones, price often wicks before continuing. Use a candle-close-based trailing rule near resistance, not a tick-based one, to avoid getting spiked out of a live winner.
- Session read is improving. You spotted doji+volume, follow-through candle, upper tail rejection, and volume spikes in real time. The reads are correct — T2’s issue was acting against your own read. The framework is working; the discipline of not trading against your own annotations is the gap to close.
- Compare to T3 from last session. T3 (28 Apr) remains your benchmark — confirmed breakdown, raised trailing after confirmation, exited on alert. T1 this session comes close to that quality. T2 is the opposite: entering near exhaustion with warning signs already visible.
Leave a Reply