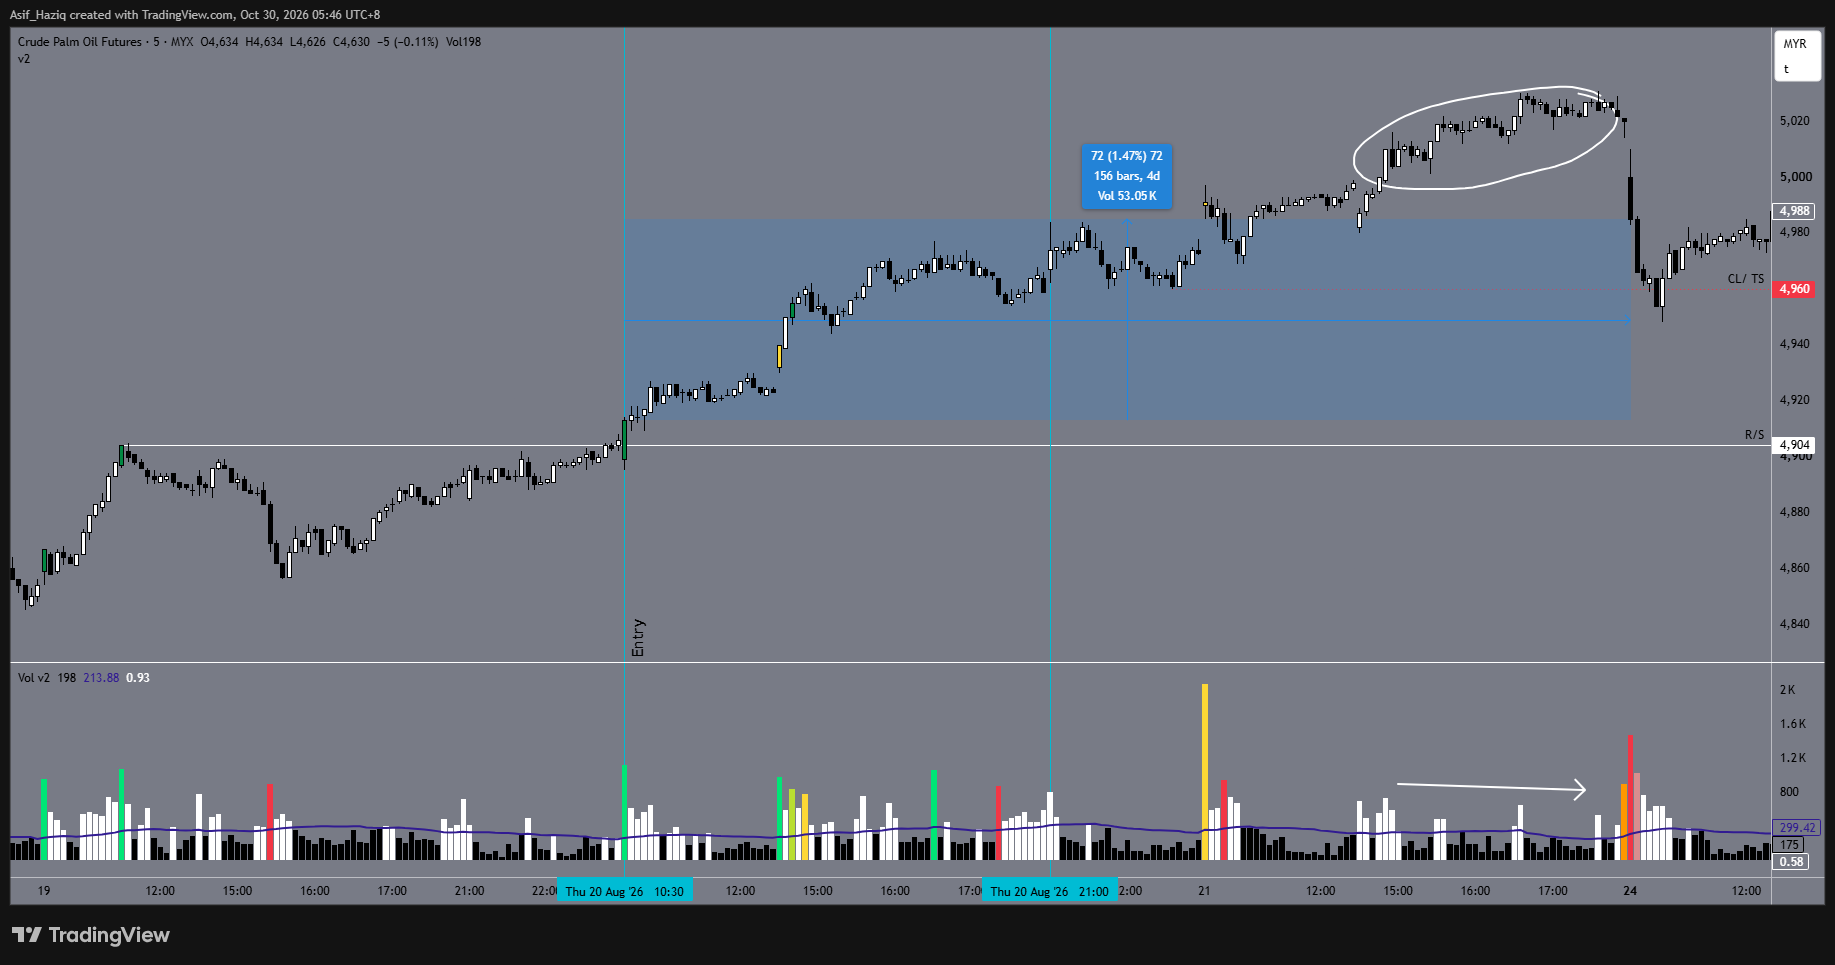
"5-minute Crude Palm Oil Futures chart showing a successful long trade. The chart highlights an entry at 10:30 on August 26 and an exit at 21:00, capturing a 72-point gain. Key technical features annotated include a strong opening, a testing candle, and a continuation trend circled near the 5,020 price level, alongside a volume indicator at the bottom."

Testing Candle, Continuation Trend & Strong Opening

Testing Candle, Continuation Trend & Strong Opening

20-24 Aug 2026
Chart


Comments

Leave a Reply

Your email address will not be published. Required fields are marked *